
| Author | Source |
|---|---|
| u/MOSfriedeggs |
Hello follow apes 🦍 this DD/TA post is a combination of my own smooth brain chart TA and the analysis of a professional trader and Youtuber named Andrew a.k.a Trading Sciences (link at the end of the post) Elliot Wave Theory/Options Chain Analysis.
This is going to be short and straight to the point as I want a maximum of Apes to understand what
might happen next week with our favorite stock. Please keep in mind these dates and prices are not set in stone, but will give you a general idea of where we could be going and what might end up happening this month. 🚀
Part I : MOAW (Mother Of All Wedges)
What Is a Wedge? (source)
A wedge is a price pattern marked by converging trend lines on a price chart. The lines show that the highs and the lows are either rising or falling and differing rates, giving the appearance of a wedge as the lines approach a convergence. Wedge shaped trend lines are considered useful indicators of a potential reversal in price action.
In this picture the Yellow lines represent our MOAW, the green line represents the approximative price where Elliot’s Waves converge it’s also a great resistance/support. The blue line was made using our lowest and highest point from January 27th to try and illustrate how explosive the stock can be in the right circumstances in this case I was estimating a price of around 600$, triggering a massive gamma squeeze in the process and putting insane pressure on the short sellers.
I’ve try to draw this wedge using different prices and the result all pointed in the same direction, as you can see we we will be breaking out the giant Doritos somewhere around the end of next week.
Part II : MacDaddy
Moving average convergence divergence (MACD) is a trend-following momentum indicator that shows the relationship between two moving averages of a security’s price. (source)
As some of you might have noticed the MACD on the daily timeframe has been green for 3 trading days now, if we look at our last two run-up it took 7-8 trading days from the time the MACD turned green to the time it peaked, if history repeat hitself we would hit another peak somewhere around thursday/friday right on schedual to break out the Doritos.


PART III : Elliot Wave Theory
In his video Andew predict the price action, he explain in detail that according to Elliot Wave theory we would hit a stock price of approx. 216$ish erly next week (Green line in the first picture/ Green circle in the picture underneath)
following a possible correction, where apes would buy the dip en masse as usual. From there, it’s impossible to predict the exact price but according to his analysis it would be around 800$+. (Keep that in mind for the next part)

Part IV : Gamma Squeeze
A “gamma squeeze” is a trading terminology that refers to massive call buying leading to higher stock prices, which leads to more call buying, a higher stock price and so on.
For a gamma squeeze to start, a group of small retail traders or one big trader betting that a stock will rise buy short-dated call options in the underlying stock.
Once they buy these call options, the investment banks and intuitional investors that sell them essentially become short the underlying stock.
Should the traders buy more call options, market makers and institutional brokers will be forced to buy more shares of the underlying stock to hedge their short position.
Just like a short squeeze, as the price of a stock begins to go up and traders increase their call positions, market makers are forced to buy the underlying the stock thus pushing its price higher.
Investors selling or writing the call are hoping the price will fall, but like going short, the downside can technically be limitless because the stock can keep on climbing instead of dropping to zero.
If a stock has low liquidity, the latter can cause the share price to rise even further, forcing brokerages to purchase even more shares as the value of their exposure increases further as the share price gets closer to the strike price of call options.
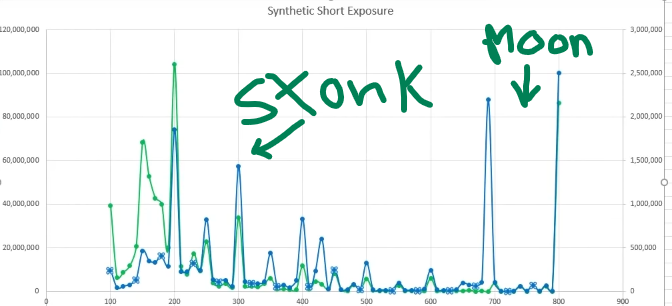
Wheter its 200$/300$/400$/600$/800$ doesn’t matter, Hedgies are fucked. By looking at the picture below I hope you understand why they fought so hard to keep the price below 180$ this week. if you want more in depth explanations on this, watch the video I linked below at the 7:41 mark where he compares GME to other stocks and tell us why this is very bullish.
Someone can correct me if I’m wrong, but in theory if we go above 200$ it could create a domino effect of FOMO/gamma squeeze that will then trigger a MOASS completly annihilating short sellers in the process.
TLDR :
Buy and HOLD. MACD, giant Wedge, Elliot Wave Theory and Options are extremly bullish for next week. I Know TA is not 100% reliable on GME, this is only my personal opinion and not financial advice.
Trading Sciences video on EWT/Options :
https://www.youtube.com/watch?v=GDeMralCaiY
Only reason this will work is because I know most APES by now have hands as hard as 💎 and would never sell at a low price. Remember the upside is limitless 🚀
I apologize in advance for mistakes as english isn’t my first language.